

 All Articles
I have received a lot of feedback from folks using the Rhythm softwaresharing how turning every 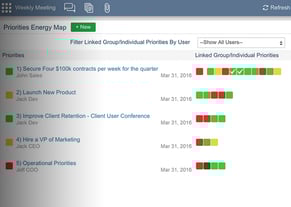 quarter into a 13 Week Race™ has really improved their execution and company results. Forecasting their ability to succeed every week appears to be a key differentiator in using Rhythm's Red-Yellow-Green® method. Every quarter, they have a strong and clear vision for execution. Then week by week, they forecast the probability of achieving their goals for the quarter. They make adjustments when necessary every single week. They try to anticipate where the challenges and obstacles may come from, and pounce on those challenges. They meet them head on, solve them and go on to win every quarter!
Tip: The key is to take action faster. The magic is in taking action, and this method of forecasting every week allows you to do so.
Setting Red-Yellow-Green Status
Here is an example of forecasting every week using Rhythm’s Red-Yellow-Green method applied to achieving a sales quota of $1 million for the quarter:
- One million dollars is the quota, so that would be Green.
- Let’s agree that anything below $700,000 would be unacceptable, so that would be Red.
- Anything in between Red and Green would be Yellow.
- And finally, for your “A Players,” let’s set $1.2 million as a stretch goal, and that would be SuperGreen®.
Forecasting with Red-Yellow-Green
At the end of each week, review your past performance and your pipeline with achieving the quarter’s goal of $1 million in mind. What is your forecast and probability of achieving that goal? Now provide a forecast - red, yellow, green or SuperGreen - based on your ability to achieve the goal for the quarter.
Now, use this prediction to take action. For instance, if achieving this sales quota is forecasted as SuperGreen, you may not need to focus as much energy on that priority and can focus on other red or yellow priorities. Spend time working on solutions and how you would move a red or yellow priority to green. What adjustments should you make? Talk to your team, work together to solve the problem, and also, help them with any red or yellow priorities. Remember, it takes all of you to succeed for the company to succeed. If you achieve success, but your teammates do not, the company still won’t achieve its goals.
Dashboards need to be the catalysts that help you identify and work on problems ahead of time. They are useless if they do not prompt discussions early enough to make a difference. Forecasting alerts you in advance if you or a team member is having trouble with a KPI (Key Performance Indicator) or a priority then gives you time to discuss and take action before it is too late.
Bold Comparison
Here is how most people work weekly. They provide a red, yellow or green status based on what they have already achieved instead of forecasting if they will achieve the stated goal. Using the same sales quota example above, they might decide the following
- Status Red until we achieve 70% or $700,000 in sales.
- Then, status Yellow until we achieve $999,000 in sales.
- Status green once we have achieved the goal of $1,000,000.
- And finally, provide a SuperGreen status when we get to $1,200,000 in sales.
The problem with tracking your weekly Red-Yellow-Green status this way is that you are focused on the past - on what you have already achieved. You are saying, “Hey, we got to $700,000.” You are not saying, “Hey, we have achieved $700,000 already, and based on my pipeline, I think we can get to $1,000,000 so we are golden!” Or, the situation might be “Hey, we have achieved $700,000 already, but based on my pipeline, I think we can only get to $800,000 this quarter, so the priority is Yellow. Let’s brainstorm how to fix this while we still have time and still win this quarter!"
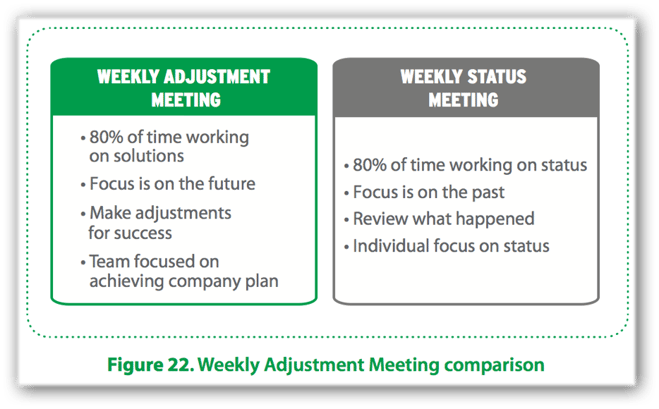
How do you status weekly? Do you do it the first way or the second way? Or maybe you have a third way to share?
Editors note: This blog post originally appeared before and has been updated.

Patrick Thean
Patrick is an award-winning serial entrepreneur, a WSJ and USA Today bestselling author, CEO Coach, and Co-founder of Rhythm Systems.
 Connect with me on LinkedIn.