KPI Status Scenarios
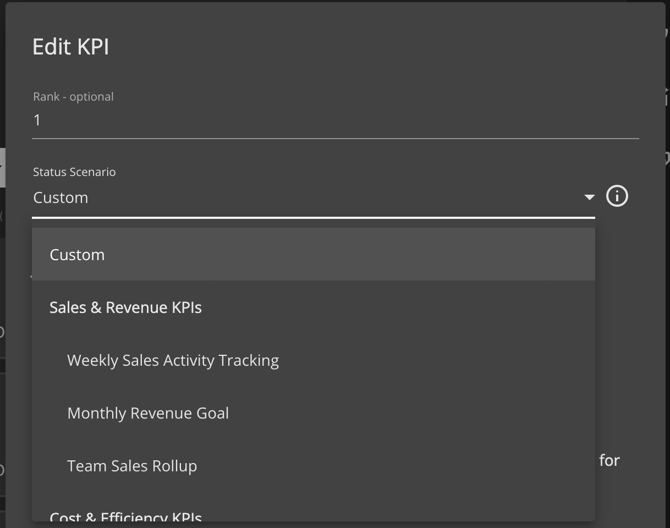
Choose a scenario to automatically update the right settings on your goal.
Sales & Revenue KPIs
Scenario 1: Weekly Sales Activity Tracking
"I want to track weekly sales activities like calls made, emails sent, or meetings held"
Auto-Settings:
▪ Variance Calculation: Actual - Projected
▪ Rollup Calculation: No Calculation
▪ Auto Status Color: Greater Than/Equal To Success Criteria
▪ Projected/Actual/Variance: Distinct
▪ Status Frequency: Weekly
▪ Percent Complete: Automatic Calculation
Scenario 2: Monthly Revenue Goal
"I want to track cumulative revenue that builds throughout the month/quarter"
Auto-Settings:
▪ Variance Calculation: Actual - Projected
▪ Rollup Calculation: No Calculation
▪ Auto Status Color: Greater Than/Equal To Success Criteria
▪ Projected/Actual/Variance: Cumulative
▪ Status Frequency: Weekly
▪ Percent Complete: Automatic Calculation
Scenario 3: Team Sales Rollup
"I want to automatically total up sales results from my team members"
Auto-Settings:
▪ Variance Calculation: Actual - Projected
▪ Rollup Calculation: Sum
▪ Auto Status Color: Greater Than/Equal To Success Criteria
▪ Projected/Actual/Variance: Cumulative
▪ Status Frequency: Weekly
▪ Percent Complete: Automatic Calculation
Cost & Efficiency KPIs
Scenario 4: Cost Reduction Goal
"I want to track expenses, errors, or other metrics I'm trying to reduce"
Auto-Settings:
▪ Variance Calculation: Projected - Actual
▪ Rollup Calculation: No Calculation
▪ Auto Status Color: Less Than/Equal To Success Criteria
▪ Projected/Actual/Variance: Cumulative
▪ Status Frequency: Monthly
▪ Percent Complete: Automatic Calculation
Scenario 5: Quality/Error Tracking
"I want to track customer complaints, defects, or incidents (lower is better)"
Auto-Settings:
▪ Variance Calculation: Projected - Actual
▪ Rollup Calculation: No Calculation
▪ Auto Status Color: Less Than/Equal To Success Criteria
▪ Projected/Actual/Variance: Distinct
▪ Status Frequency: Weekly
▪ Percent Complete: Automatic Calculation
Project & Initiative Tracking
Scenario 6: Project Milestone Completion
"I want to track project deliverables or tasks completed"
Auto-Settings:
▪ Variance Calculation: Actual - Projected
▪ Rollup Calculation: No Calculation
▪ Auto Status Color: Greater Than/Equal To Success Criteria
▪ Projected/Actual/Variance: Distinct
▪ Status Frequency: Weekly
▪ Percent Complete: Automatic Calculation
Scenario 7: Strategic Initiative Progress
"I want to track high-level initiatives that don't have specific numbers"
Auto-Settings:
▪ Variance Calculation: N/A (No numbers)
▪ Rollup Calculation: No Calculation
▪ Auto Status Color: No Calculation (Manual Entry)
▪ Projected/Actual/Variance: Cumulative
▪ Status Frequency: Quarterly
▪ Percent Complete: Enter Manually
Team Performance & Productivity
Scenario 8: Individual Performance Metric
"I want to track individual team member productivity (content created, tasks completed, etc.)"
Auto-Settings:
▪ Variance Calculation: Actual - Projected
▪ Rollup Calculation: No Calculation
▪ Auto Status Color: Greater Than/Equal To Success Criteria
▪ Projected/Actual/Variance: Distinct
▪ Status Frequency: Weekly
▪ Percent Complete: Automatic Calculation
Scenario 9: Department Performance Rollup
"I want to automatically average team performance across multiple people"
Auto-Settings:
▪ Variance Calculation: Actual - Projected
▪ Rollup Calculation: Average
▪ Auto Status Color: Greater Than/Equal To Success Criteria
▪ Projected/Actual/Variance: Cumulative
▪ Status Frequency: Weekly
▪ Percent Complete: Automatic Calculation
Customer & Marketing KPIs
Scenario 10: Lead Generation Tracking
"I want to track leads, website visits, or other marketing metrics"
Auto-Settings:
▪ Variance Calculation: Actual - Projected
▪ Rollup Calculation: No Calculation
▪ Auto Status Color: Greater Than/Equal To Success Criteria
▪ Projected/Actual/Variance: Distinct
▪ Status Frequency: Weekly
▪ Percent Complete: Automatic Calculation
Scenario 11: Customer Satisfaction Score
"I want to track NPS, CSAT, or other satisfaction ratings"
Auto-Settings:
▪ Variance Calculation: Actual - Projected
▪ Rollup Calculation: No Calculation
▪ Auto Status Color: Greater Than/Equal To Success Criteria
▪ Projected/Actual/Variance: Distinct
▪ Status Frequency: Monthly
▪ Percent Complete: Automatic Calculation
Variance-Based Tracking
Scenario 12: Budget Variance Tracking (Positive Variance = Good)
"I want green status when I'm under budget (positive variance)"
Auto-Settings:
▪ Variance Calculation: Projected - Actual
▪ Rollup Calculation: No Calculation
▪ Auto Status Color: Green if Variance is Greater Than/Equal to 0
▪ Projected/Actual/Variance: Cumulative
▪ Status Frequency: Monthly
▪ Percent Complete: Automatic Calculation
Scenario 13: Performance Gap Tracking (Negative Variance = Good)
"I want green status when I exceed my target (negative variance)"
Auto-Settings:
▪ Variance Calculation: Projected - Actual
▪ Rollup Calculation: No Calculation
▪ Auto Status Color: Green if Variance is Less Than/Equal to 0
▪ Projected/Actual/Variance: Distinct
▪ Status Frequency: Weekly
▪ Percent Complete: Automatic Calculation
Special Use Cases
Scenario 14: Event-Based Tracking
"I want to track goals that happen on specific dates or as-needed"
Auto-Settings:
▪ Variance Calculation: Manual Entry
▪ Rollup Calculation: No Calculation
▪ Auto Status Color: No Calculation (Manual Entry)
▪ Projected/Actual/Variance: Distinct
▪ Status Frequency: Any Day
▪ Percent Complete: Enter Manually
Scenario 15: Annual Strategic Priority
"I want to track high-level annual goals with infrequent updates"
Auto-Settings:
▪ Variance Calculation: Manual Entry
▪ Rollup Calculation: No Calculation
▪ Auto Status Color: No Calculation (Manual Entry)
▪ Projected/Actual/Variance: Cumulative
▪ Status Frequency: Quarterly
▪ Percent Complete: Enter Manually
Variance Calculation
Note: This content reflects our Premium software's default features and labels. For any questions, please email help@rhythmsystems.com.
Don't worry about making mental math mistakes subtracting to get the Variance each week. Rhythm can automatically calculate the Variance for you when you enter numbers for Projected and Actual.
Setting it up is simple; edit your KPI and select an option under Variance Calculation.
You have 2 options:
- Projected - Actual: Use this if you want Rhythm to subtract the Actual values from the Projected Values. This is the setting to pick if you want the Variance to be positive if you are behind your Projection for the week. (For example, if you projected 2 blog posts and only wrote 1, the Variance would be 1.)
- Actual - Projected: Use this if you want Rhythm to subtract the Projected values from the Actual values. This is the setting to pick if you want the Variance to be negative if you are behind your Projection for the week. (For example, if you projected 2 blog posts and only wrote 1, the Variance would be -1.)
Note: The following characters will not prevent Rhythm from completing math calculations: K k M m ` ~ ! @ # $ % ^ & * ( ) + = _ , £ € < > ; ' " { } | ? [ ] \ / Ensure that you do not include other characters in the Projected or Actual fields.
Rollup Calculation
Stop hunting for numbers from the team and crunching them yourself. Let Rhythm do the math for you on goals that roll up. This setting is useful if you need to calculate the Sum or Average for linked Child Goals.
To turn on calculations, change the Rollup Calculation setting to one of these options:
- Sum: Gives the total of the Projected, Actual, and Variance from linked Child Goals.
- Average: Gives the average of the Projected, Actual, and Variance from linked Child Goals.
Once you've changed the setting, be sure to link the Child Goals so Rhythm can do the math for you.
Note: If you've turned on Rollup Calculations, you will not be able to edit the Projected, Actual, Variance numbers in your Parent Goal. Those will be auto-calculated from the numbers entered in the linked child goals.
Helpful Tips:
Your data is only as good as the data entered in Child Goals, so as the owner of the Parent KPI or Priority, you should establish clear standards for how the data should be collected and recorded and communicate those standards to the owners of the Child Goals:
- Make sure you are all measuring the same way.
- Agree on a quarterly, monthly, or weekly time horizon.
- Decide on a deadline for updating the status of Child Goals so all the data is ready when you update the Parent Goal.
- You cannot roll up a goal with a Status Frequency that is less often than the Status Frequency of the parent goal (for example, you can't add two monthly KPIs up to a weekly KPI).
Automatically Update Status Color
- This setting is only applicable for goals that you status based on the Actual number each week. If you are basing your status on a forecast of how you will finish the month or the quarter, you'll need to continue updating the status manually, using your human intelligence to make the right forecast.
- If you do have a KPI or Priority that you status based on the Actual number each week, this feature can save you a lot of time.
Here's how to set it up:
Change the "Auto Status Color Setting" from No Calculation (Manual Entry) to one of the following options:
- Greater Than/Equal To Success Criteria: Use this setting if you are trying to increase the number. For example, "# of sales calls" is something we want more of, so we'd choose this option.
- Less Than/Equal To Success Criteria: Use this if you are trying to decrease the number. For example "# of customer complaints" is a number we'd like to see go down, not up.
- Green if Variance is Greater Than/Equal to 0: Use this if your status should be Green when the Variance between the Projected and Actual is a positive number. The status will be Red for any negative Variance values.
- Green if Variance is Less Than/Equal to 0: Use this if your status should be Green when the Variance between the Projected and Actual is a negative number. The status will be Red for any positive Variance values.
Note: Ensure you don't have any text in your Red-Yellow-Green success criteria; use numbers only. You may have to change how you word your goal name or description so that your goal will still be specific and clear. For example, you might have to change the KPI name from "# of calls" to "# of calls per week" to clarify what you are measuring.
When you are updating your KPIs each week, all you'll have to do is put in your Projected, Actual, Variance number. Rhythm will do the work of assigning a Status color based on your Red-Yellow-Green success criteria.
Projected/Actual/Variance Setting
Depending on how you enter your Projected, Actual, and Variance values for each Goal, ensure that you have selected the right setting so that your data shows up correctly in the status chart. You have 2 options under Projected/Actual/Variance Setting:
- Distinct (Single Status Period): Choose this option if you are entering the Actual value each week. Rhythm will add the weekly values up to get a monthly total for you in the Chart.
- Cumulative (Total Quarter to Date): Choose this option if you are entering a cumulative value for the quarter in the Actual field each week. Rhythm will display the value for the last week of the month in the Chart since you've already done the math when you enter data each week.
Distinct means your numbers reflect only the current period — not a running total. Each week stands on its own.
Cumulative means all your numbers are running totals from the start of the quarter to right now.
For Distinct, you are asking "how did I do this week?" and for Cumulative, you are asking "how am I doing overall so far this quarter?"
For example:
| Week | Weekly Amount DISTINCT: |
Running Total CUMULATIVE: |
|---|---|---|
| Week 1 | $10 | $10 |
| Week 2 | $15 | $25 |
| Week 3 | $8 | $33 |
Why this matters:
- When your Trend Chart shows a monthly number, it will either show the number from the last week in the month (Cumulative), or it will add together all the numbers you entered and show the total of those in the chart for that month (Distinct).
- Your percent complete works the same way - it will just take the latest number you entered and calculate based on that (Cumulative) or it will add up all the numbers you've entered so far this quarter and calculate on that (Distinct).
- If you change how often you status, this setting will affect how the data you have already entered when you make the change.
Status Frequency
Choose how often you'd like to update the status of this goal:
- For Quarter Priorities and KPIs, we recommend updating the goals Weekly.
- You can use the Monthly option for results-based KPIs that only change monthly.
- We recommend updating Winning Moves and Annual Priorities Quarterly.
- If you have a goal you want to status on a particular date or once per day, choose Any Day.
Here's an example of how you might set up a goal that drills down from Quarterly all the way to Any Day:
NOTE: You can change the Status Frequency of a goal once it has been set. If you've already added a status, you will need an Admin or our Support Team to help.
Percent Complete
Rhythm can automatically calculate the % complete for your goals by comparing the Actual number you enter to the number in the Green Criteria.
- If you have the goal set to "Distinct" Projected/Actual/Variance Setting, Rhythm will add up all the Actual values you have entered and calculate the percent based on the total of your entries.
- If you have the goal set to "Cumulative" Projected/Actual/Variance Setting, Rhythm will use the value for the week closest to the end of the quarter that has an Actual value to calculate the percent.
- If you aren't entering numbers but want to manually track the % complete of a goal, you can change the % Complete setting to "Enter Manually" and drag the slider to indicate how close you are to your goal.
- The % Complete is tied to the success criteria for the goal, so if you are tracking the same KPI with different criteria for the quarter and the year, you can see the % complete for both sets of criteria.