Note: This content reflects our Premium software's default features and labels. For any questions, please email help@rhythmsystems.com.
Why Choosing the Right View Matters
We've given you the flexibility to view different information about your goals in the list so you can have what you need at your fingertips whether you are preparing for a weekly meeting, analyzing trends in your financial KPIs over time, or trying to decide which priorities are most important to tackle this quarter.
Custom Goal View Options
Any time you are looking at a list of Goals, you'll see the following options:
- Table View: see more at once in a simple, customizable view
- If you need to see more goals at once, or choose which attributes of the goals to display, this easy table is right for you!
- You can use the "Display Settings" icon
 to choose which goal properties to display as columns in the table and drag and drop the columns to re-order them.
 - You can sort the rows in the table by clicking on the column headers to put the rows in ascending or descending order.
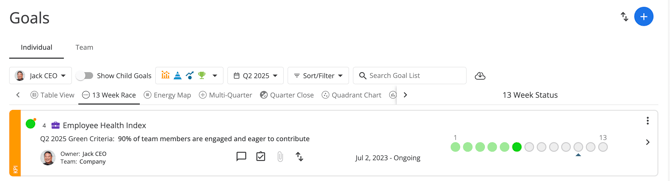
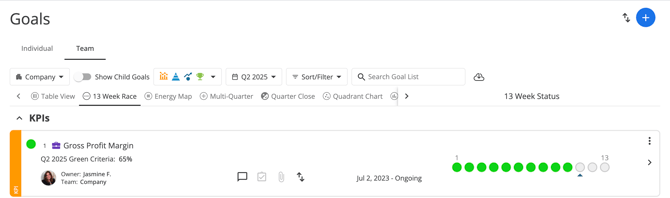
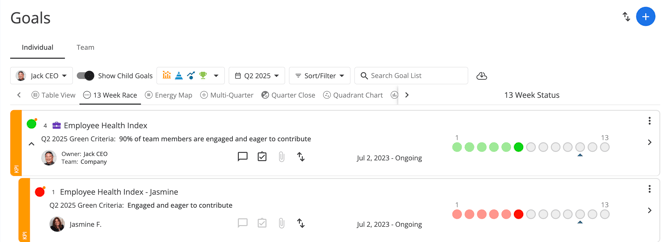
- 13 Week Race: see status trends from week to week in the quarter
- This is great if you like the details and want to changes from one week to the next
- Each circle or square represents one week in the quarter
- For Priorities, squares will show as a diamond in the week of the quarter in which the End Date falls to give a visual indicator of when the Priority is due.
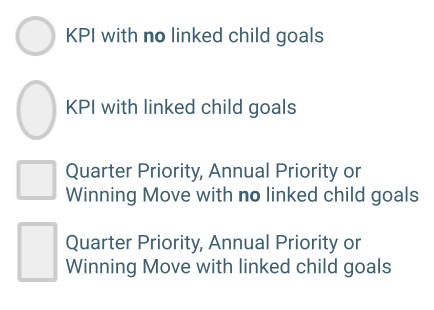
- Energy Map: see high-level status for linked child goals
- This view is highly effective for team meetings
- It allows you to see a nice summary of team's progress on goals before deciding where to drill in for more discussion
- It also helps you see that enough of the team's energy is allocated to achieving the top goals
- The supporting goals are represented by the following shapes:
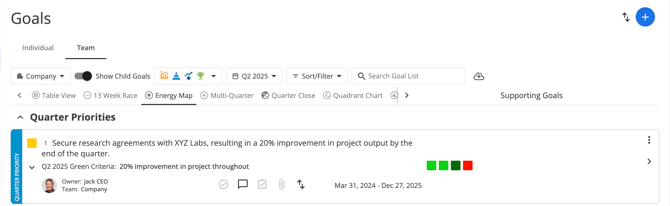
- For Priorities, squares will show as a diamond to the left of the priority name if the Priority has not yet been updated in the selected quarter
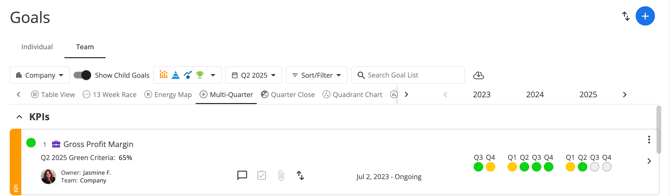
- Multi Quarter: look for trends in status over time
- This view is great for Annual Priorities, Winning Moves or KPIs that span multiple quarters
- You can see how each quarter finished and look for patterns or red flags
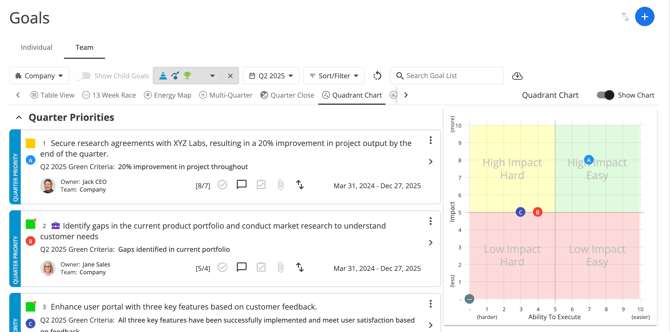
- Quadrant Chart: plot goals on Impact and Ability to Execute
- This view could be helpful in planning
- You can rank Annual Priorities, Quarter Priorities or Winning Moves on their potential Impact and your Ability to Execute
- The chart can help you decide which goals are most important to put energy and resources into now
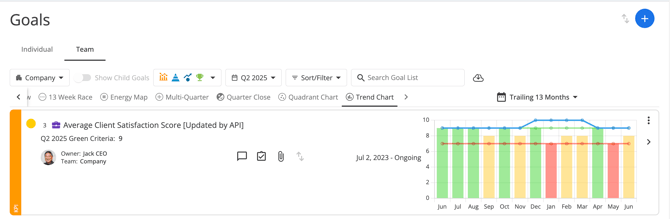
- Trend Chart: analyze data in customizable charts
- This is helpful for KPIs or other goals that you measure with numbers in the Projected, Actual, Variance fields
- You can see the data in a bar chart over a trailing 13 month period, for the selected quarter, or for a custom time period you set
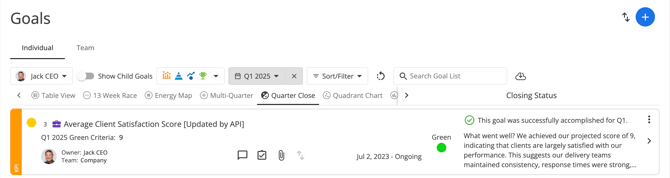
- Quarter Close: review closing status and reflection for goals
Showing Child Goals
Use the toggle to switch between views that allow you to see child goals nested under the parent goals in your list or just show a flat list of goals:
- Enable Show Child Goals: expand to see linked child goals listed under the parent goals
- This is usually best for Team Leaders who may have other goals that roll up under their goals
- If you like to drill down on the details or need to build out child goals from the list, this is the view for you
- Disable Show Child Goals: see all of the goals for the User or Team, regardless of links
- We recommend using this view for Weekly Meeting Prep. This way, you won't miss updating any goals that may be linked under another goal in the other view