

Our guest blogger today is Howard Cox, CPA, CMA, CIA. Launching his career with a Big Four firm in  1983, Howard established his own practice just four years later—and, in late 2001, merged his independent CPA firm into Somerset CPAs and Advisors' operations. Currently, Howard focuses on general Business Advisory, Mergers and Acquisitions and PPACA Compliance engagements, and also conducts informative presentations for clients, as well as outside events.
The quality of business performance is dependent on the quality of management decisions. The quality of management decisions is dependent on the quality of management information.
Strategy is about focus. Customers are a key element of effective strategies. Optimal allocation of finite resources towards appropriate customer focus can only come from customer knowledge. Therefore, having a deep analytical understanding of relative customer profitability is a critical prerequisite to annual or quarterly strategic thinking.
The remainder of this post will be dedicated to a proven and disciplined process of customer profitability analysis. You can perform the below customer profitability analysis on individual customers or combined customer groups (residential vs. commercial, etc.).
Level 1 Customer Profitability Analysis Example:
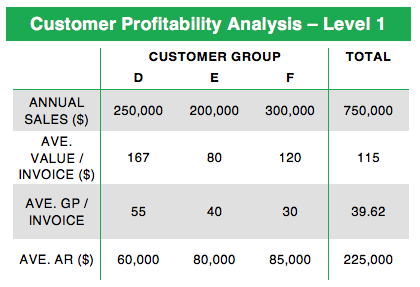
Analyze the three distinct customer groups in the above illustration. In this example, your total annual sales for Group D are $250,000, for Group E they are $200,000 and for Group F they are $300,000. For many, this is as far as the analysis of customer profitability would go. Therefore, the normal conclusion would be that Customer Group F is the most significant contributor.
However, there is deeper analysis you can perform on your own customers or customer segments. In it, we will drill down to the activity level in your business to take into consideration some activity based costing parameters. We recommend this analysis because of the golden rule in business: activities drive costs, so you must manage your business at the activity level.
To perform this deeper analysis, you need to consider more information: average sale value, average cost of sale or gross margin, and average level of accounts receivable outstanding. This will allow you to make a much more informed decision about which customers are actually the best in terms of return on investment. Let’s take a look at that sort of analysis below.
Level 2 Customer Profitability Analysis Example:
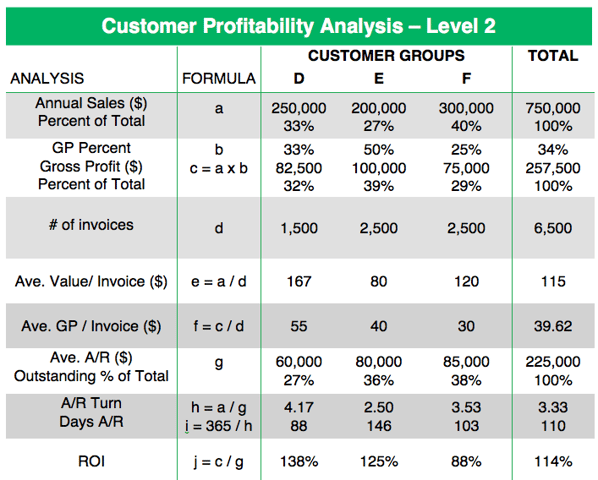
In this example, Customer F contributes the highest amount of sales revenue, yet returns the lowest gross margin of the three customers AND has the lowest return on investment. Potentially, that could mean that if you were able to free up some of the time and resources taken in servicing customer F and allocate that to customer D or E, your bottom line could be increased.
Of course, there are other factors to be taken into consideration, such as marketing costs associated with acquiring a new customer within each customer group, selling costs associated with selling and delivering a product within each customer group, etc. Even costs such as interest could come into play. For example, you might need to invest heavily in a machine to make a product for one particular customer group only. This analysis will not provide you with the complete answer. It is intended to be a diagnostic tool to get you thinking. Without the analysis, however, nothing changes and potential opportunities are lost.
If you have a very large customer base, this type of analysis might seem to be a daunting task. You might want to start with an analysis of the customers or customer groups that provide 80% of your sales. This typically would have you analyzing about 20% of your customers (Pareto’s Law). The objective of this analysis is to identify who really is most profitable (measured by ROI), so that you can then find out why this is and what they all have in common. Then, you can turn your attention to how you can attract more of those sorts of customers into your business.
The ROI is calculated based on the relationship between the annual gross profit provided by the customer (this is the return from the customer) in comparison to the average amount of receivables outstanding (that is, your investment in your customers). Now you will have some management information to work with in terms of determining your ideal customer profile, or your core customer. The answer to the question “Who most values your unique value proposition?”
Click here to download an Excel spreadsheet template you can use for customer profitability analysis.
To hear more from our partners at Somerset CPAs and Advisors, don't miss our webinar on April 19!
Photo Credit: iStock by Getty Images


Rhythm Systems
 Connect with me on LinkedIn.