
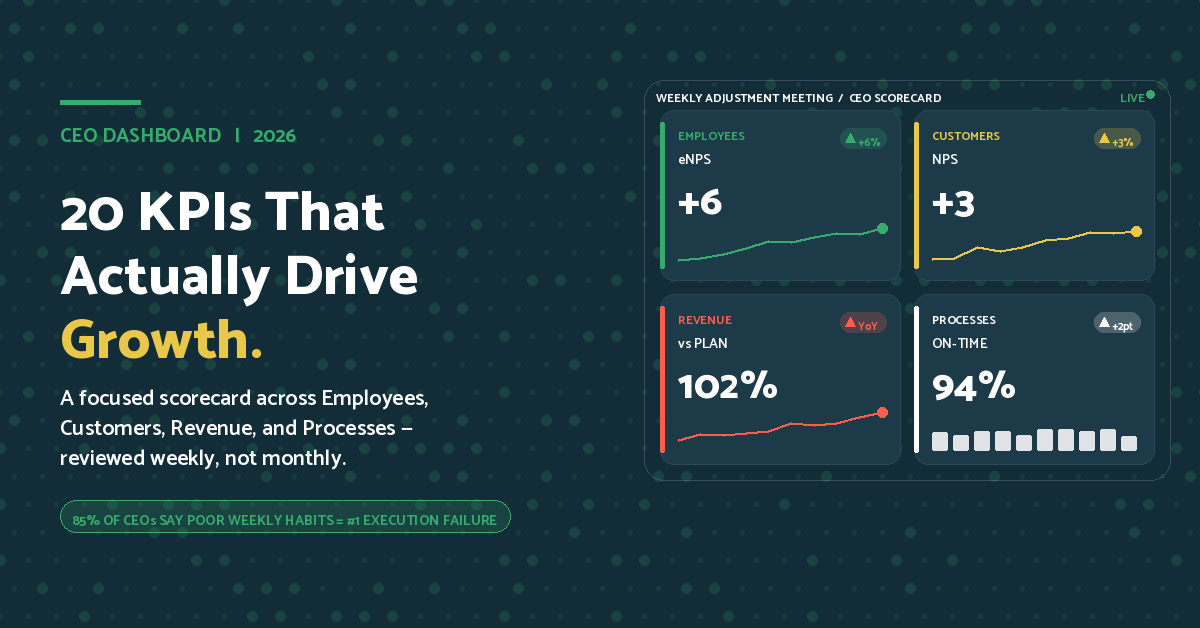
A CEO dashboard should track 12–20 KPIs across four categories — Employees, Customers, Revenue, and Processes — with a deliberate mix of leading and lagging indicators. Most dashboards get this wrong by defaulting to “financials” and calling it a day. Here's what to track, why it matters, and the mistakes that quietly kill dashboard effectiveness.
What Is a CEO KPI Dashboard — and Why Does It Matter?
Most CEOs have data. What they're missing is the right data, reviewed consistently, by the right people.
A CEO KPI dashboard is a real-time scorecard that consolidates your most critical metrics across the entire business — not just financials, not just sales, but a balanced view of how your company is actually performing. The goal is straightforward: every week, your leadership team should be able to answer one question — are we on track, and if not, where do we need to act?
Without it, decisions get made on gut feel or month-old reports. Neither works when you're growing.
What's Changed Since 2023?
CEO dashboards look different than they did even two years ago. Three shifts are driving it:
AI is now measurable. CEOs are beginning to track AI adoption rates, time saved per employee, and the percentage of workflows augmented by automation. These weren't standard KPIs in 2022. Teams leading in adoption are showing 20–30% productivity gains (McKinsey, 2025).
Cash efficiency replaced growth-at-all-costs. The post-2022 environment pushed CEOs to track revenue per employee, gross margin trends, and burn multiples alongside top-line numbers. Revenue growth alone stopped telling the full story.
Employee data moved upstream. Voluntary attrition and monthly pulse scores used to live in HR. Now they're CEO-level KPIs. If your people are quietly disengaging, your results will reflect it — usually six months too late to course correct easily.
How Many KPIs Should a CEO Track?
Aim for 12–20 total, with 3–5 per category. More than 20 creates noise and dilutes focus. Fewer than 10 leaves blind spots. The sweet spot is a focused set of metrics your leadership team can genuinely own and discuss every week — not a spreadsheet that takes 45 minutes to scroll through.
The framework we use at Rhythm Systems organizes KPIs into four categories: Employees, Customers, Revenue, and Processes. It's adapted from Kaplan and Norton's Balanced Scorecard, built to reflect how mid-market leadership teams actually operate within the Think-Plan-Do execution cycle.
What's the Difference Between Leading and Lagging KPIs?
This is the distinction most dashboards get wrong — and it's the one that matters most.
Lagging indicators — revenue, churn, net margin — tell you what already happened. Leading indicators — pipeline coverage, NPS trend, voluntary attrition rate — tell you what's coming.
Most CEO dashboards are heavy on lagging metrics, which means leadership teams spend their time reacting instead of leading. In Rhythm's Weekly Adjustment Meeting (WAM) framework, leading indicators are the ones that actually drive in-quarter decisions. Aim for at least one leading indicator in every category.
What KPIs Should a CEO Track? The Full Framework
Employees
Your people are your most expensive asset — and your most predictive one. The KPIs in this category tell you whether your team is engaged, growing, and planning to stick around.
Employee NPS (eNPS) is the simplest pulse check available. Would your employees recommend working here? Best-in-class mid-market companies score above 40. Below 20 is a warning sign worth investigating before it shows up in attrition numbers.
Voluntary attrition rate is your most powerful leading indicator for culture health. Under 10% annually is strong. Above 15% demands CEO-level attention — not just an HR fix. Replacing a single mid-level employee runs 50–200% of their annual salary. This number compounds fast when ignored.
Beyond those two, track A-Player percentage across your roles and your high-potential employee count — these tell you whether you have the bench strength to execute your next phase of growth.
And in 2026: add AI tool adoption rate by department. The percentage of employees actively using AI-assisted workflows is becoming one of the more predictive indicator of efficiency.
Customers
Customer KPIs answer one essential question: are we acquiring, keeping, and expanding the right relationships?
Net Promoter Score (NPS) remains the most widely used customer loyalty signal — it's a single number that reflects customer sentiment across the entire experience. Track the trend over time, not just the point-in-time score.
Customer churn rate is your early warning system. Know your number monthly, not quarterly. By the time churn shows up in your revenue line, the underlying problem is usually six months old.
The ratio that best represents your business model's health is CLV:CAC — customer lifetime value divided by acquisition cost. A ratio of 3:1 or higher means your growth economics are working. Below 2:1 means you're spending more to acquire customers than the relationships can support.
Rounding out this category: track new logo revenue to confirm you're penetrating new markets (not just renewing existing accounts), and monitor customer complaints and escalations as a leading indicator of churn before it hits retention numbers.
Revenue and Financials
Revenue KPIs answer: Are we growing profitably, and do we have the runway to execute our strategy?
Revenue versus Annual Plan is the baseline — if you track nothing else, track that. But on its own, it's incomplete.
Gross margin gives you the profitability picture behind the top line. Benchmarks vary: 70%+ for B2B SaaS, 40–60% for professional services, 25–45% for manufacturing. Know your industry baseline — margin KPIs only mean something in context.
EBITDA belongs on every CEO's dashboard, especially for PE-backed companies or those planning an exit. Cash flow runway — months of operating capital remaining — should be reviewed in your Weekly Adjustment Meeting without exception. And revenue per employee is increasingly critical as AI reshapes thinking about headcount. If this number isn't trending up year-over-year, it's worth asking why.
Processes
Operational KPIs tell you whether your business can scale — or whether you're building on a foundation that cracks under pressure.
On-time delivery and fulfillment rate are among the most predictive metrics on a CEO's dashboard. It tells you whether you're doing what you promised — and it often predicts NPS and churn better than any survey.
Defect rate and quality scores catch problems before they become customer issues. Rework is expensive, and quality problems compound fast when ignored.
Operating efficiency ratio — cost to generate one dollar of revenue — measures whether the business is getting more scalable over time. And cycle time on key workflows is worth tracking specifically in the context of AI. If your core processes aren't getting faster as AI tools mature, that's a signal worth investigating.
A Note on Sales Pipeline KPIs
These typically live on your VP of Sales dashboard, but growth-stage CEOs often pull two or three up to the top level. Pipeline coverage ratio (healthy benchmark: 3x quota), MQL and SQL volume, and win rate by segment are the ones most worth a CEO's attention — not to micromanage sales, but to see around corners on revenue performance before it shows up in the numbers.

How Do You Build a CEO KPI Dashboard?
Start with your Quarterly Plan priorities, not a list of every metric you could theoretically track. Your KPIs should measure what matters most this year — full stop.
From there:
- Select 3–5 per category with a conscious mix of leading and lagging indicators
- Assign one named owner to each KPI — not a team, one person
- Set a baseline and a target — a KPI without a target is just data
- Review it weekly, not monthly. Dashboard KPIs reviewed monthly become lagging indicators by default. Weekly reviews are what allow leading indicators to function as early warning signals rather than post-mortems
This is the execution rhythm that separates teams that course-correct in real time from those that discover problems at quarter-end.
What Are the Most Common CEO Dashboard Mistakes?
The most common reason CEO dashboards fail isn't bad data — it's bad habits around the data.
Too many KPIs is the most frequent problem. When everything is important, nothing is. More than 20 metrics means attention gets spread too thin to act on any of them.
Over-indexing on lagging indicators. If revenue and margin are your only KPIs, you're always reacting to history. You need metrics that tell you what's coming.
Ownership gaps. KPIs without a single named owner get monitored but not managed. Everyone watches the number; no one moves it.
Monthly instead of weekly reviews. By the time a monthly review surfaces a problem, you've already lost four weeks of response time.
Setting it and forgetting it. Business conditions shift, and a dashboard that was right in Q1 may be measuring the wrong things by Q3. Revisit it quarterly as part of your Quarterly Planning process.
If you're ready to build a dashboard your leadership team will actually use every week, see how Rhythm Systems helps mid-market CEOs execute with clarity — or talk to a Rhythm strategist to get started.
.png)
Courtney Dyer
Courtney is Rhythm Consulting Program Manager. With experience helping clients grow their businesses and achieve their goals. Her background is in non-profits, human resources, and technology.
 Connect with me on LinkedIn.