
Guest Post by Sara Estes, Content Marketing Manager at Pendo
If you work in product, you know that measurement is a core facet of the job. From software usage to customer feedback to NPS -- there’s more data available to product managers (PMs) than ever before. As a result, expectations are shifting, and PMs need to be able to not only create a delightful user experience, but quantify it, too.
But, which metrics matter the most? And more importantly, how do you know what “good” performance really means?
Of the seemingly endless KPIs you could be measuring, we at Pendo believe five numbers are crucial to effectively understanding your product’s performance: stickiness, feature adoption, app retention, product engagement score, and account-level NPS. Better yet: with our product benchmarks, we’re giving you the opportunity to see how your product compares to your peers for each of the five metrics.
Here’s a breakdown of each Product KPI, why it matters, and how to measure it effectively.
1. Stickiness
Since a product’s success ultimately depends on retention, it’s important to attract new users and ensure they continuously stay engaged. Stickiness measures product engagement by examining how many users return on a regular basis. When a product is sticky, users don’t just sign up and log in occasionally -- the product becomes part of their daily professional life. The stickier your customers are, the easier it is to predict your recurring revenue in the future with a decreased churn rate and employee engagement metrics top HR professionals use.
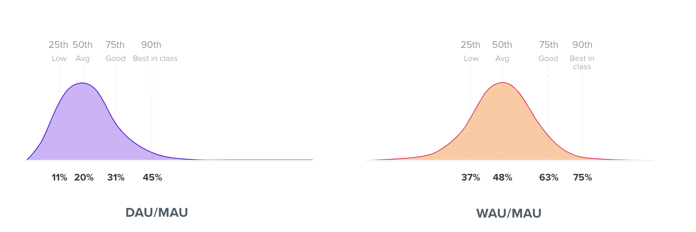
Here are two ways to measure stickiness:
- DAU/MAU: the ratio of daily active users (DAU) to monthly active users (MAU); also known as the percent of monthly users who engage with your product daily
- WAU/MAU: the ratio of weekly active users (WAU) to monthly active users (MAU); also known as the percent of monthly users who engage with your product weekly
2. Feature Adoption
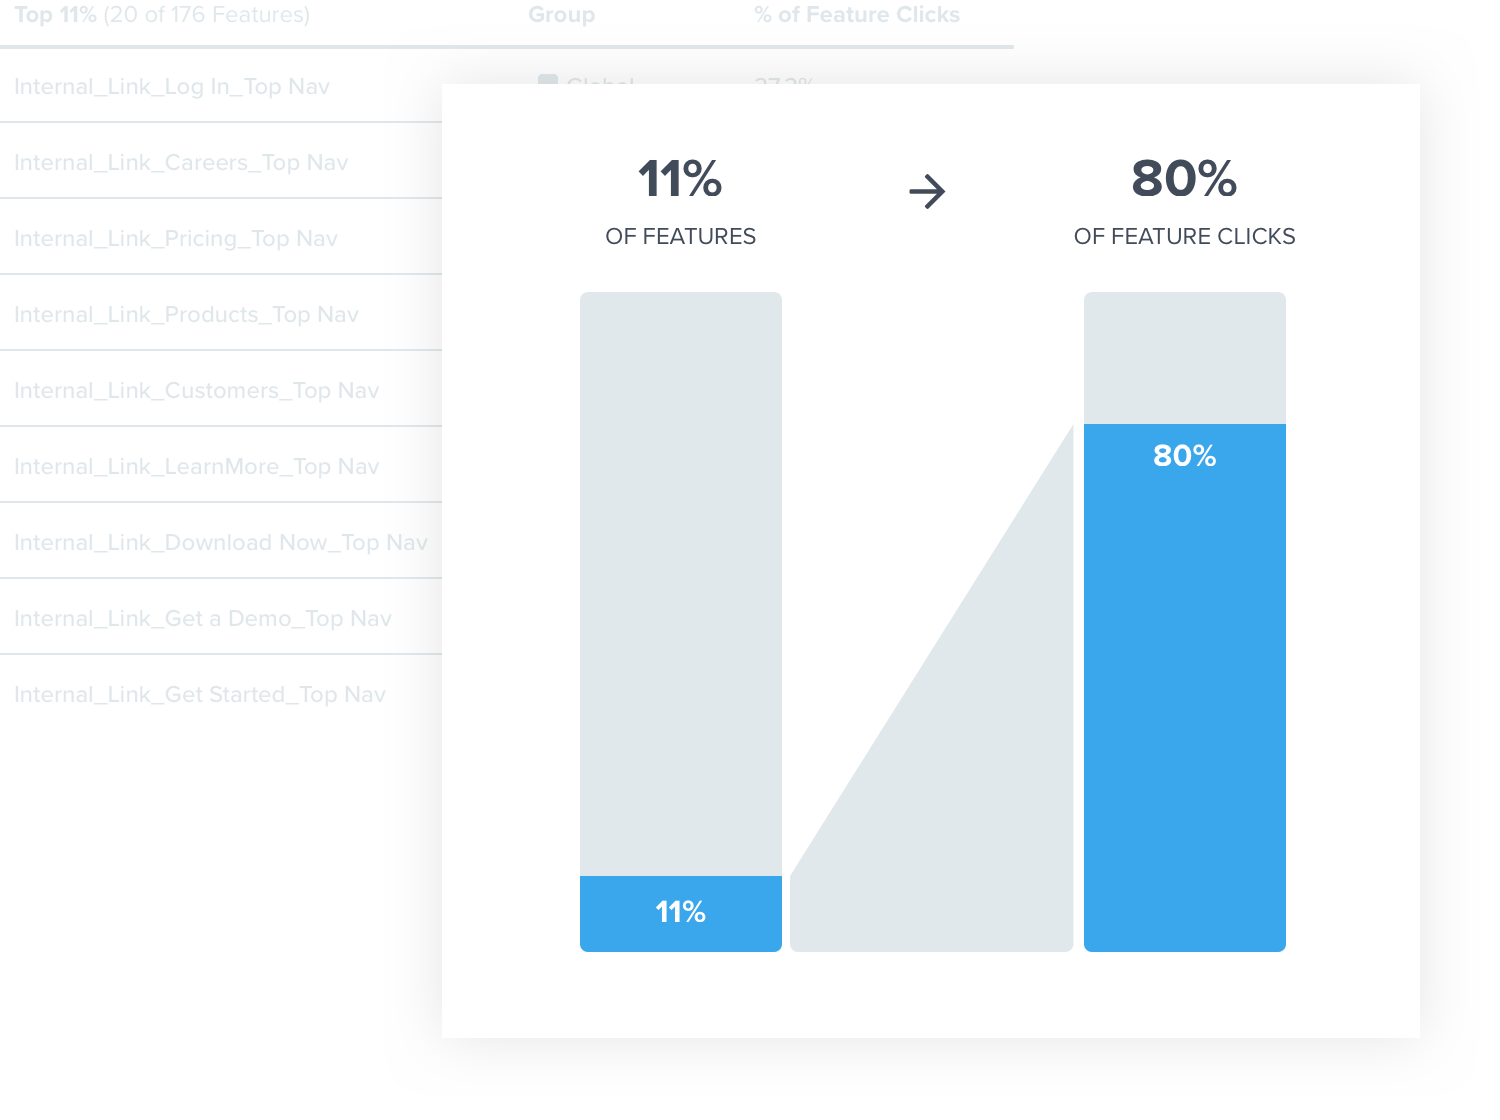
Similar to stickiness, feature adoption is important for retention, specifically in predicting customer churn. Think about it: the more features a user adopts, the more value they receive, and the less likely they are to churn.
You can measure feature adoption either as a count over time (feature adoption rate = [feature MAU / monthly logins] * 100), or with respect to click volume (e.g. the percentage of features that generate 80% of clicks). Track your feature adoption to ensure that you are building features that enhance your retention rate and adjust your product development accordingly.
3. App Retention
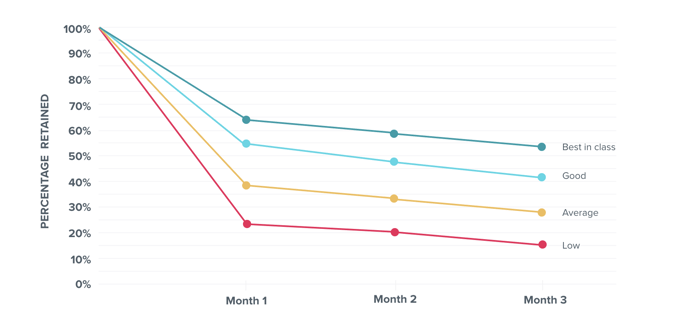
Like many things, product usage is most useful when evaluated over time. It’s one thing to know your product’s number of users at any moment -- but only when you know how many users continue using your product can you begin to understand if the experience you’re creating is keeping users engaged. This will also help you understand if (and when) there are drop-offs.
App retention can be measured over virtually any time period and will really depend on your product, your business, and what you’re looking to learn. One common way to measure app retention is by taking the percentage of users retained in the first three months of usage.
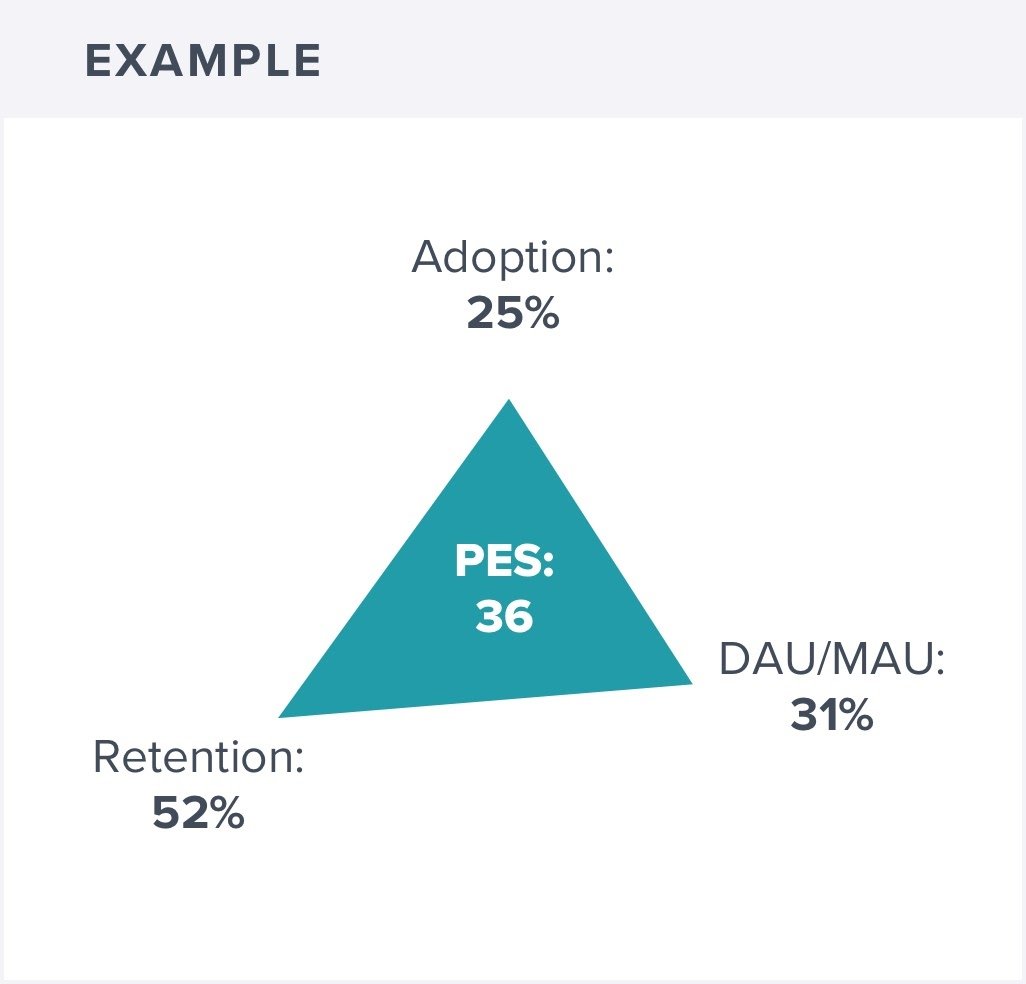
4. Product Engagement Score
Just as NPS is to sentiment, product engagement score (PES) offers a more holistic view of product engagement. It averages stickiness, feature adoption, and app retention into a single data point, giving you an easy way to assess how users are engaging with the product overall.

PES can be expressed mathematically as:
[(Feature Adoption + App Retention + Stickiness) / 3] * 100
5. Account-Level NPS
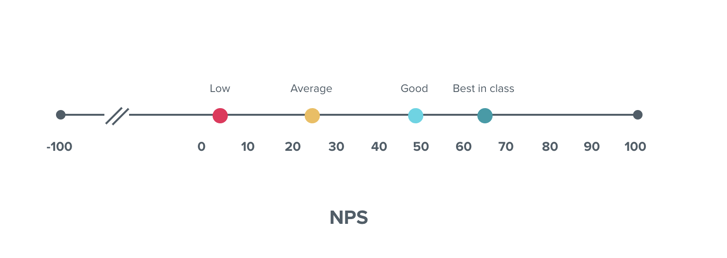
Net Promoter Score (NPS) has become one of the most popular ways for companies to gauge customer loyalty and customer satisfaction. But it goes beyond that, too. Since NPS asks customers how likely they are to recommend a company’s product or service (on a scale from 0 to 10), you can connect the dots to customer happiness and, eventually, business growth.
To calculate NPS, subtract the percentage of Detractors (those who respond 0 - 6) from the percentage of Promoters (those who respond 9 - 10):
[(#Promoters / #Respondents) – (#Detractors / #Respondents)] * 100
If you’re ready to see how your product stacks up for each of the five KPIs, check out the product performance benchmarks here. You’ll also be able to download a set of custom slides that you can use to showcase your own product’s performance against the benchmarks and help bring a data driven approach to your product management KPIs.
Looking for some KPI Examples to help get you started? Check out our additional KPI resources:
Comprehensive List of 179 KPI Examples for Any Industry
27 Recruiting KPI Examples for the Staffing Industry
25 KPI Examples for Manufacturing Companies
21 Production KPI Examples to Improve Manufacturing Performance
Employee KPI Examples: How to Measure What (or Who) You Want to Move (Video)
KPI Examples for Successful Sales Teams
Rhythm Systems KPI Resource Center

Rhythm Systems
 Connect with me on LinkedIn.