
 Wed, May 7, 2014 @ 09:30 AM
 Twitter
 LinkedIn
 Facebook
 Mail
Mail
 Copy link
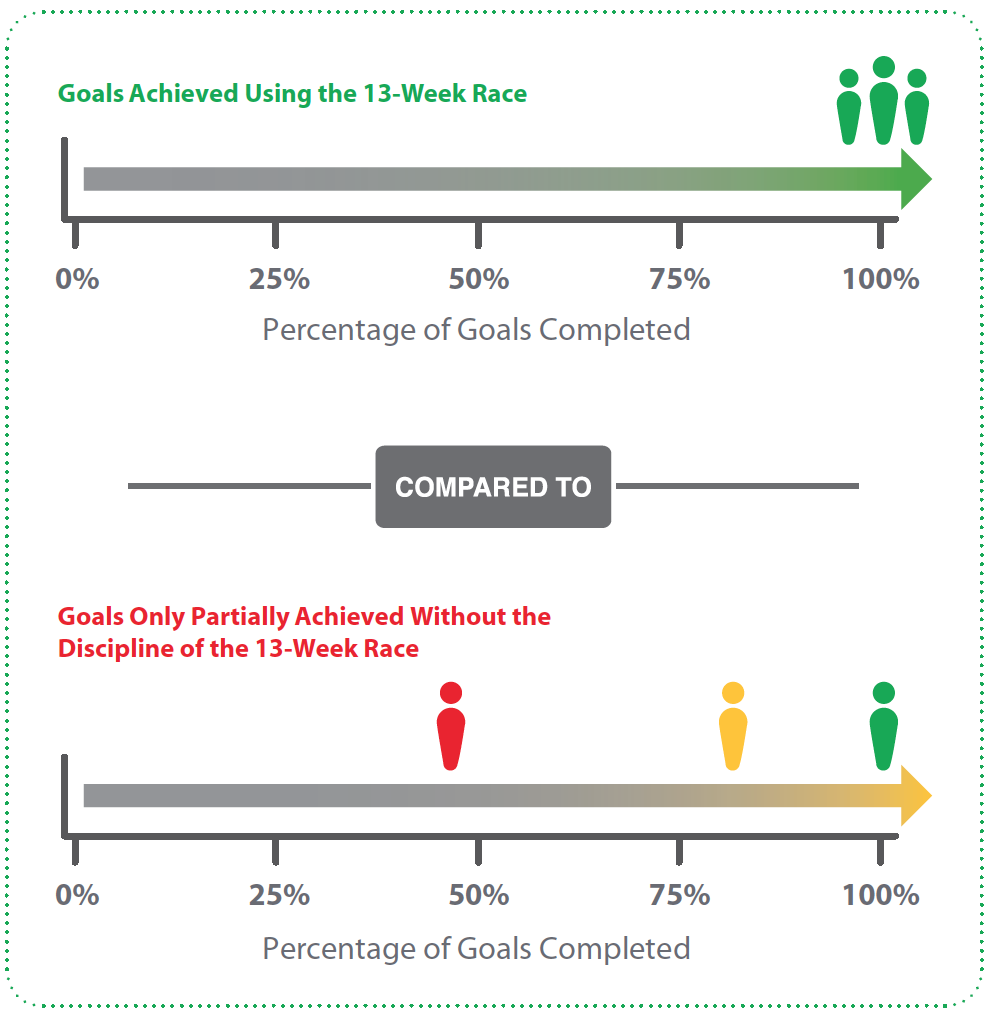
Every quarter is a 13 Week Race. Most of us have priorities to deliver and KPIs (Key Performance Indicators) to measure our progress. If you don’t, you probably should pause and work on your execution plan for the rest of quarter. But let's say you do have priorities and KPIs. How do you measure your progress? Many of us use a Red, Yellow or Green status to indicate our progress. There are two common methods for updating your status.
Method 1: I've seen many people provide a status based on "percent complete" as the current status. It's simple, and it's based on where you are right now.
Green - done
Yellow - between 50% and 100%
Red - less than 50%
In this method, the status of a priority is always Red until it hits 50%, then it switches to Yellow, and then finally, when all is done, it moves to Green. The problem with this method is that it focuses you on where you are right now. It does not point out when there may be a problem lying in wait for you up ahead. It does not tell you the true probability of achieving the priority. You might be on track now, but will you be next week? Most of all, it does not prompt a discussion or conversation. Meetings with these types of statuses can be pretty boring.

I prefer Method 2.
Method 2: Set your status based on your ability to complete your priorities successfully. To do that, you need to first begin with the end in mind. Be extremely clear on what achieving success looks like. Then set your Red-Yellow Green success criteria based on what success looks like. For example, if you need to achieve $1mm in sales, set your success criteria this way:
Green - the target is $1mm, so this is green
Yellow - between red and green
Red - the minimum level of performance you have agreed to. For example, it could be $700,000. Then Red = $700,000 or less.
And... SuperGreen is the stretch goal. Let's make that $1.2mm for our example!
Now the fun part. Every week, status based in your prediction, your forecast of whether you will achieve the priority.
Here are some examples or scenarios:
- Scenario 1: It's week 5. You have actually achieved $400,000, but you see no problems hitting your $1mm target. It's all clear blue skies ahead. You would status this Green. Your status is not based on what you have achieved, rather it is based on your end in mind. Are you set up to achieve your priority?
- Scenario 2: It's week 5. You have actually achieved $400,000. But your pipeline is drying up and you are concerned that you might not be able to achieve past the $700,000 line. So you status it Red. At your weekly meeting, this becomes a catalyst for a discussion for solutions to help you make an adjustment to achieve your priority. You've got 8 more weeks. What are you going to do proactively that is different to achieve your priority?
This is a minor major (a minor major is a minor tweak to your process that could give you significantly different results). Dashboards need to be the catalysts that help you identify and work on problems ahead of time. They are useless if they do not prompt discussions early enough to make a difference. Using Method 2 alerts you in advance if you or a team member is having trouble with a KPI or a priority. You can then discuss and take action before it is too late.

Photo Credit: iStock by Getty Images